Key KPIs for efficient long-term energy plant management.
By: Shashank Navaratna and Allan Evora
KPIs, or key performance indicators, show how effectively a plant is achieving its objective, namely: energy efficiency. Having just a few important metrics to track gives operators basic values to benchmark against, and quickly take corrective measures when performance isn’t optimal.
The days of an operator being strictly there to push buttons and respond to indicators are over. People aren’t getting paid for how much they work, but the value they bring to their organization in reducing cost, waste, and increasing facility output. Hence the importance of KPIs.
As a system integrator, we’re trying to introduce basic metrics to help operators better manage and optimize energy plants. If integrated correctly, KPIs help demonstrate two things:
- Daily: the move toward higher efficiency
- Historically: today is an improvement compared to a year ago
Why measure chiller plant efficiency, and other KPIs?
Plant operators make important efficiency decisions every day. For example:
- How many chillers should we run?
- Does it make sense to run a single chiller up to full capacity and bring on a second?
- At what point should we bring on a third?
A tool like SCADA allows operators to see the impact of their actions on efficiency in real time.
Often an operator will see an increase in efficiency, but not know why it happened. Was it because they adjusted a set point, or brought on a new machine? A SCADA system allows them to go back and see the state of the system during the increase.
In addition to providing the real-time status of this equipment via alarms, process deviations, and malfunctions, operators can also adjust this equipment directly from the SCADA system.
—Chilled water—
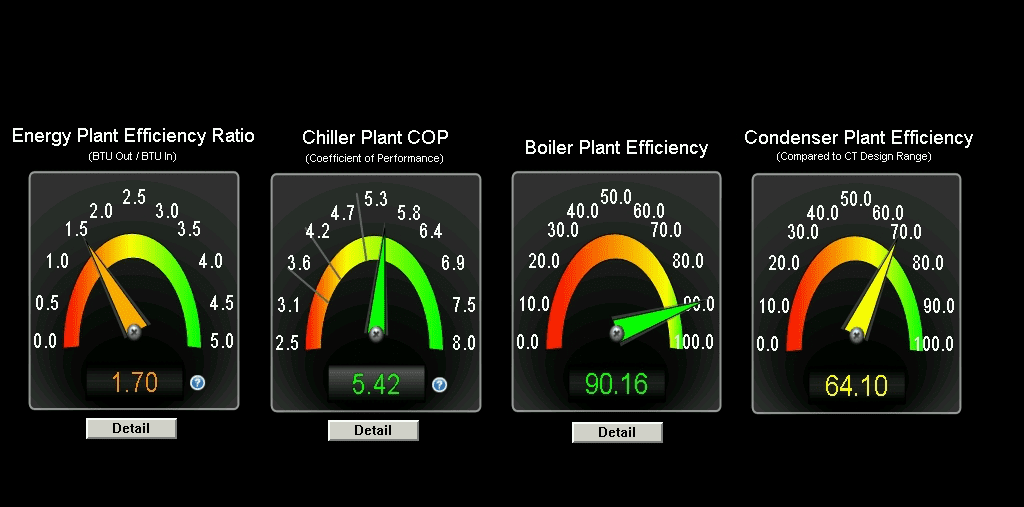
With respect to a chiller plant, we measure three specific performance KPIs:
- KW per ton for each individual chiller
- Overall condenser plant efficiency
- Overall chiller plant COP (coefficient of performance)
KW per ton for each individual chiller
This metric shows how many KW are required for each individual chiller to produce a ton of chilled water. We integrate instrumentation to measure electrical input to not only the chiller, but also the pumping systems
For this metric, the lower the number, the better.
Overall condenser plant efficiency daily/hourly
The biggest users of energy are the cooling tower pump motors. We calculate overall condenser system efficiencies and average that based on currently active chillers.
Because this KPI is a ratio of actual delta T to design delta T, it’s a number between 0 and 100. The higher the better.
We calculate the difference between the hot condenser water temperature entering the cooling water, and the leaving condenser water temperature. If the temperature coming in is 80 degrees Fahrenheit, and the desired temperature leaving is 70 degrees Fahrenheit, that’s a 10-degree difference. But if the tower’s cooling range was designed for a 25-degree difference, that tower would only be 40% efficient.
By averaging out each tower’s efficiency, we get an overall condenser plant efficiency.
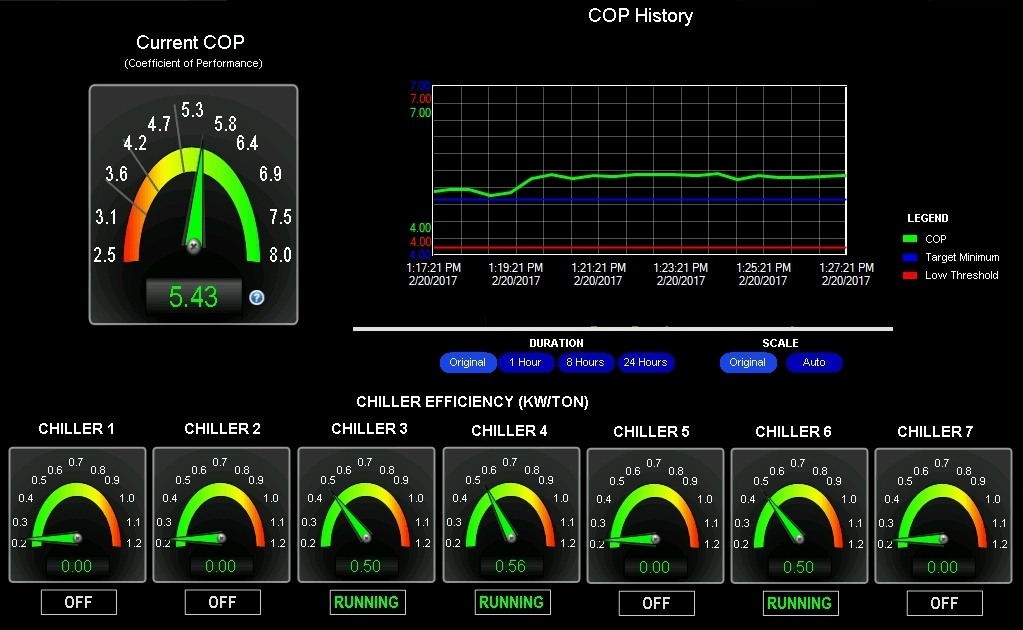
Overall chiller plant COP daily/hourly
 It’s easy to copy the OEM’s KPI from an individual chiller to see how its performing against the manufacturer’s specification. The hard part is, most energy plants have more than one chiller, and they’re installed at different timelines.
How do you calculate the energy input for multiple chillers? It’s all about the ratio of heat removal to energy input.
We quantify the overall chiller plant KPI through the coefficient of performance (COP). We take into account not only individual chiller performance, but also energy required by chilled water loop and pumping systems that move the chilled water to the load. Total tons of water produced is divided by electrical input to the plant.
The conclusion is a number greater than 1.
One of our central energy plant customers with seven chillers ranges between an overall chiller plant COP of 2.5 to 8. Operators know that the more they can drive output higher, the more efficiently that plant is operating.
—Steam—
With respect to a steam plant, we measure two specific performance KPIs:
- Individual boiler plant efficiency
- Overall boiler plant efficiency
Individual boiler plant efficiency
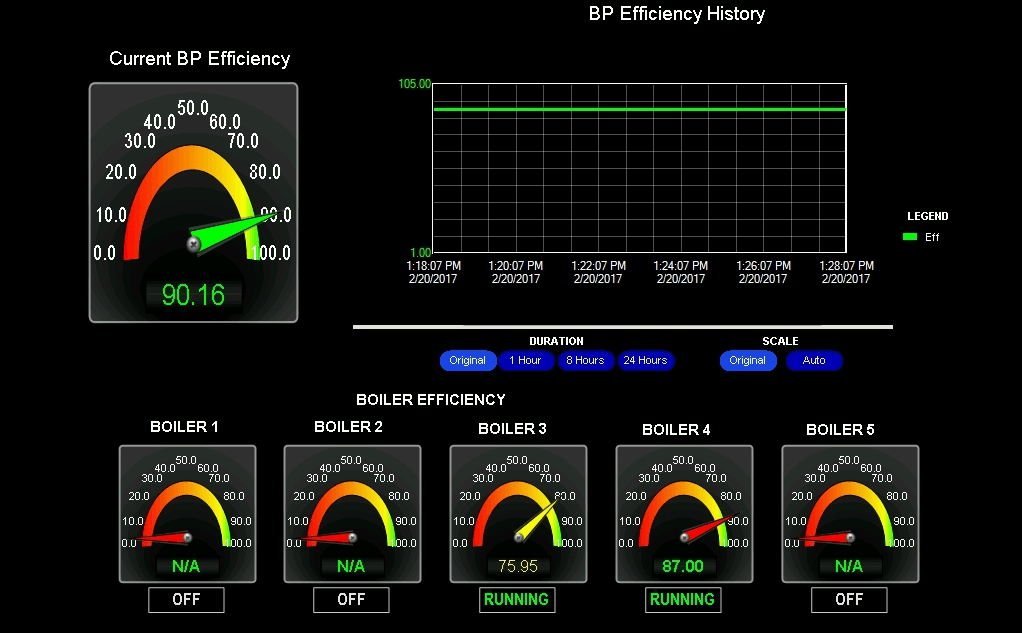 Individual boiler plant KPIs are obtained through the controls of the OEM. That’s a number between 0 and 100. In the example HMI, you’ll see five Cleaver-Brooks controlled boilers. For any operating boiler, this screen shows operators the metrics of individual boiler efficiency.
Overall boiler plant efficiency daily/hourly
We measure the output from each boiler (total supplied steam in pounds per hour), convert that to BTUs, and compare it to the heat input to the boilers. This is primarily natural gas or fuel oil and its associated calorific value. The ratio of total BTU steam production to fuel input BTU is how we calculate overall boiler plant efficiency.
—Overall energy plant—
With respect to the overall plant, we measure just one specific performance KPI:
- Current energy plant efficiency ratio
Current energy plant efficiency ratio
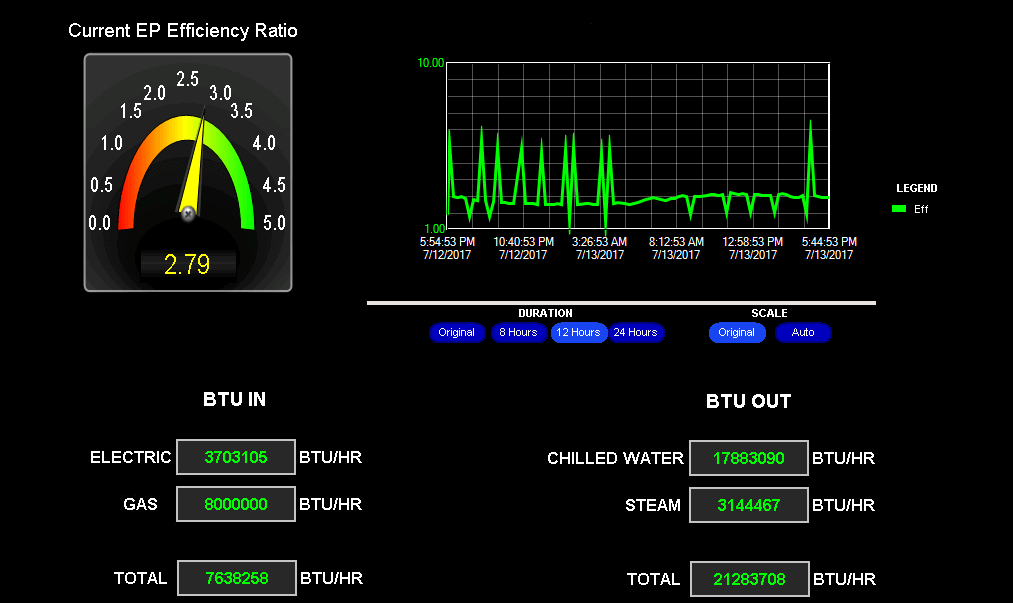 The overall energy plant takes into account chilled water and steam production, and other systems that require energy in order for plant to operate, including:
- Fuel oil distribution system
- Plant HVAC system
- Lighting
- Receptacle loads
- Computer systems
- Electrical transformation losses
We calculate this KPI every 30 minutes. The KPI is really a performance number similar to COP and it is typically greater than 1. We convert the cooling capacity from tons to BTU/hr., the steam to BTU/hr., and examine the energy consumed in the plant to produce that heating and cooling capacity. The owner then uses this metric as another measurement that gets tracked over time to determine if the general operation of the energy plant is moving in the right direction.
Run your plants efficiently using KPIs
Our experience with energy plants has taught us one thing: running an energy plant is not a science. There’s no magical efficiency equation or recipe for success. An energy plant is a very dynamic environment to say the least.
With all the moving parts, even external pieces (like outside temperature) come into play. Sometimes you’re restricted by the limitations of a certain equipment’s design. Sometimes it makes sense to run less efficiently when the cost of fuel is cheap during the day, and run more efficient when electricity prices are high during peak demand.
Our instruments and measurement devices measure the particular performance of each system part. The KPIs provided show the high-level impact of decisions, such as running specific pieces of equipment or changing set points.
At the end of the day, it boils down to the process that produces/maintains a consistent patient care environment at lowest cost possible.
 Shashank Navaratna is an Application Engineer at Affinity Energy with responsibility for installing hardware, integrating Modbus networks, setting up site local area networks, configuring remote access connections, programming data loggers and other I/O devices, coding alarming logic, and integrating full remote monitoring systems.
With a strong educational background in controls and instrumentation, Shashank joined Affinity Energy in 2016. His previous work experience includes an internship at Honeywell Process Solutions where he gained hands-on experience in process control technologies like distributed control systems and PLCs.
Shashank graduated from the University of North Carolina at Charlotte with a Master of Science in Electrical and Electronics Engineering. In his free time, Shashank plays cricket, soccer, and loves to sketch still life.