Designing a solar HMI to be intuitive for efficient operation.
By: Adam Baker
On a typical solar SCADA screen, there are too many numbers. I’m talking about anything from inverter temperature to meter kVARh. When an operator is adrift in a sea of numbers, finding the one number that deserves operator attention, is almost impossible.
 So many SCADA providers and system integrators don’t have a deep understanding of the application they’re visualizing. They don’t know how things are logically organized at the solar plant, or how they should physically represent them within the HMI.
At the end of the day, they collect numerical tag data from devices…so that’s what they stick on the overview SCADA screen.
The problem is, it’s difficult for operators to memorize correct values for each process, and correlate that with the number that’s displayed on the SCADA screen. It’s a bad design, which leads to bad solar farm operation.
So, what should be on your SCADA screen?
Your main SCADA screen should tell you how the site’s doing at a high level. You want as much pertinent information as possible that summarizes how the plant is running. The real design challenge is how to display the critical info that causes the operator to 1) take immediate corrective action, or 2) get to more details to diagnose what’s going on in just a few clicks.
During diagnosis, you’ll still need the ability to click on things to drill down for more details.
Check out this SCADA screen from a large, partially completed site. This is a great example of what should be on your main overview.
Related: Designing HMIs for situational awareness
Heat Map
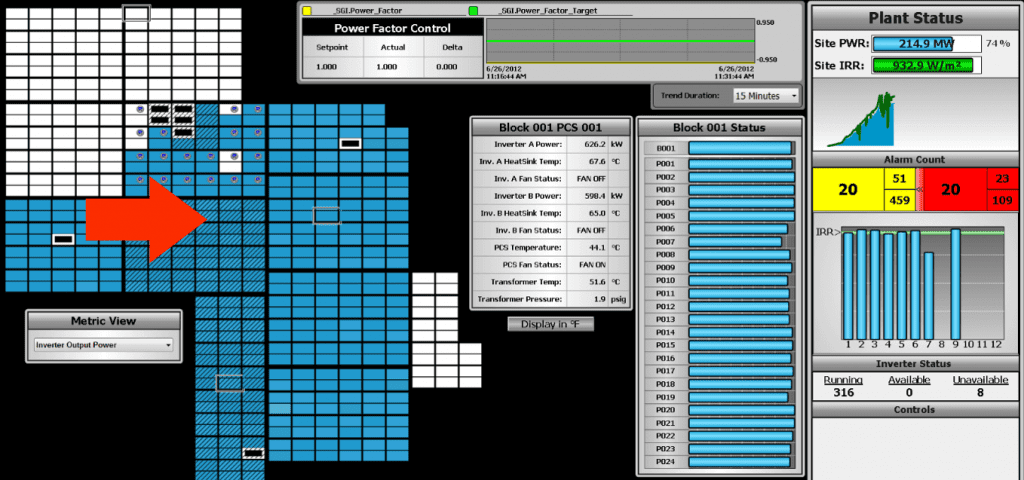
One challenge, especially at large sites, is how to easily monitor hundreds of devices in one place. Hundreds of tag data on an overview screen would be absolutely nonsensical. There’s no way an operator would be able to make heads or tails of 500 inverter output values.
As the example screen shows, a heat map lets you visually see if 520 inverters are in balance or out of balance. The key to an effective heat map is data normalization. Normalization takes the raw data and adjusts it based on other values or percentages.
If you only have three inverters, a heat map view might still be beneficial, but should be restricted to the minority of SCADA screen real estate…not the majority.
Detailed Inverter & PCS Data
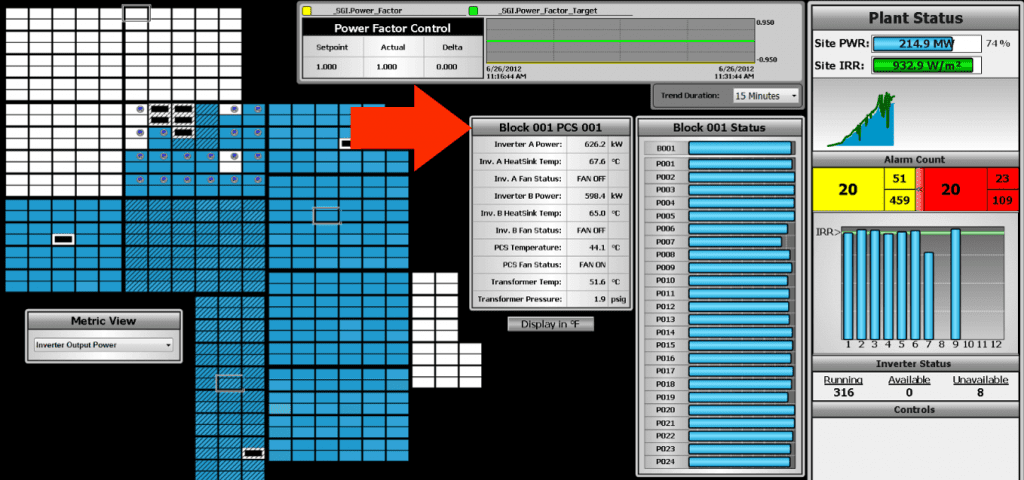
If you mouse over a particular inverter rectangle from the heat map, a section pops up with the data from the inverter. This allows you to get important details without navigating away from the main overview screen.
If you click on an inverter rectangle, the detail for that inverter pad will replace the site overview screen, but most important details can be gleaned by hovering the mouse over the area in question.
You’ll see the same data at the far right in a vertical bar graph at the block level. Normalizing the data allows comparison of 30MW blocks with 17MW blocks on the same scale (0-100% of block design capacity). Here we see blocks 1 – 6 close to design capacity (though block 1 has a slightly underperforming inverter, and block 4 has an inverter that is offline), but block 7 is at about 80% of capacity. This snapshot was taken when block 7 was actively in startup, so not all inverters were running. Easy to see in the heatmap, and easy to see in the block output comparator.
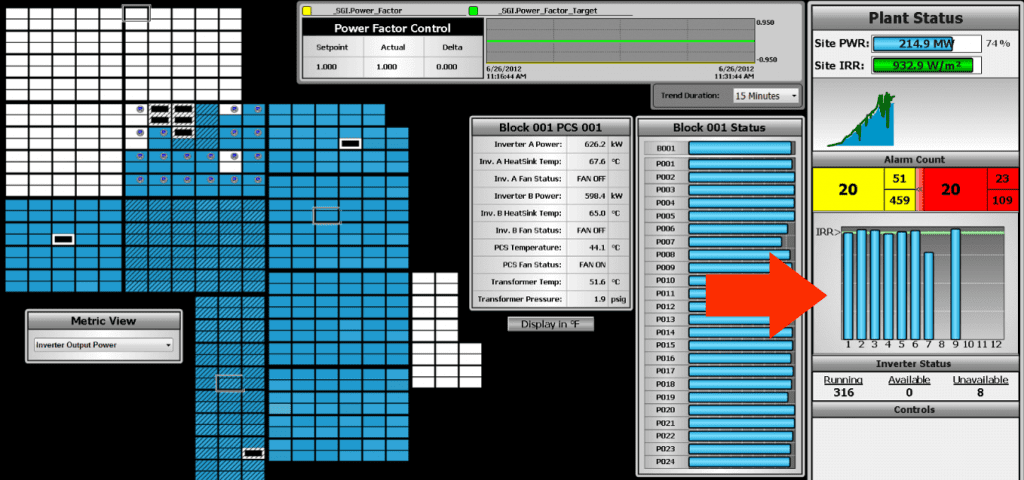
High Level Summary
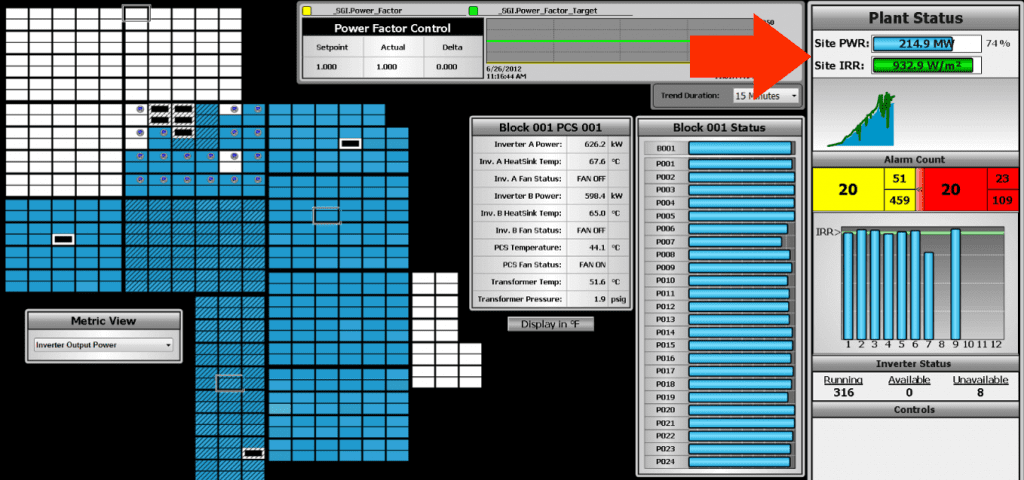
Persistent through all SCADA screens (even on drill down screens) is a high level summary of the most important information in the right column. From the plant status information, an operator can tell if the site is running, the amount of irradiance, and how much power it’s making compared to what it’s rated for.
Power output over time is represented by the blue line, and irradiance is represented by the green line. In general, those two colors should track with each other. Operators know that if power goes down but irradiance stays up, some component of generation is likely offline.
Alarms
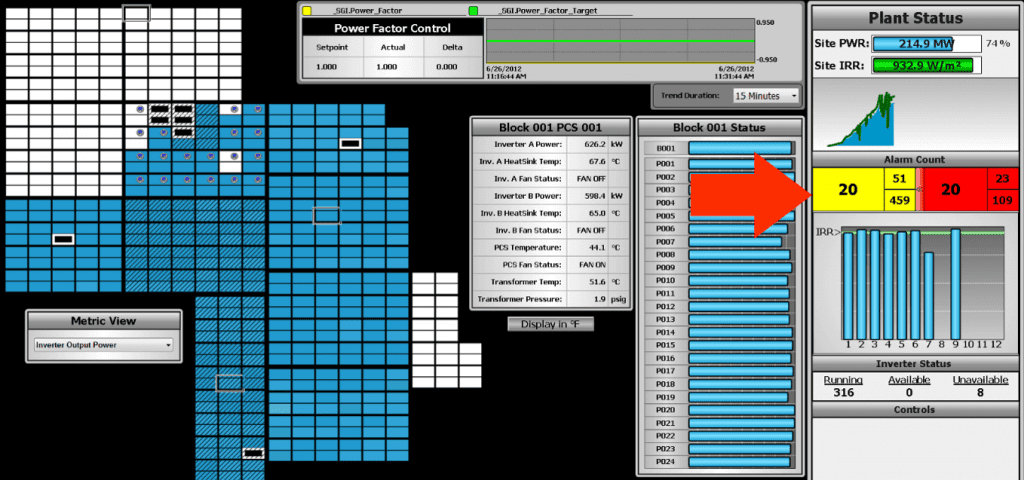
Some operators prefer a banner across the bottom that shows the most recent alarms. (Obviously, highest priority alarms should always show up at the top.) However, if you know you’re going to get a lot of alarms coming in at once (like sites under construction), the value of that banner is diminished. (Related: Best practices for smart SCADA alarming)
I prefer an alarm count section, like the one in the example. The alarm count section shows warnings in yellow, and alarms in red. The big box shows issues in alarm and unacknowledged. The two smaller numbers show the acknowledged alarms and out of alarm, unacknowledged.
It’s a great high-level alarm overview that doesn’t bog an operator down with details until they are ready to dig into them.
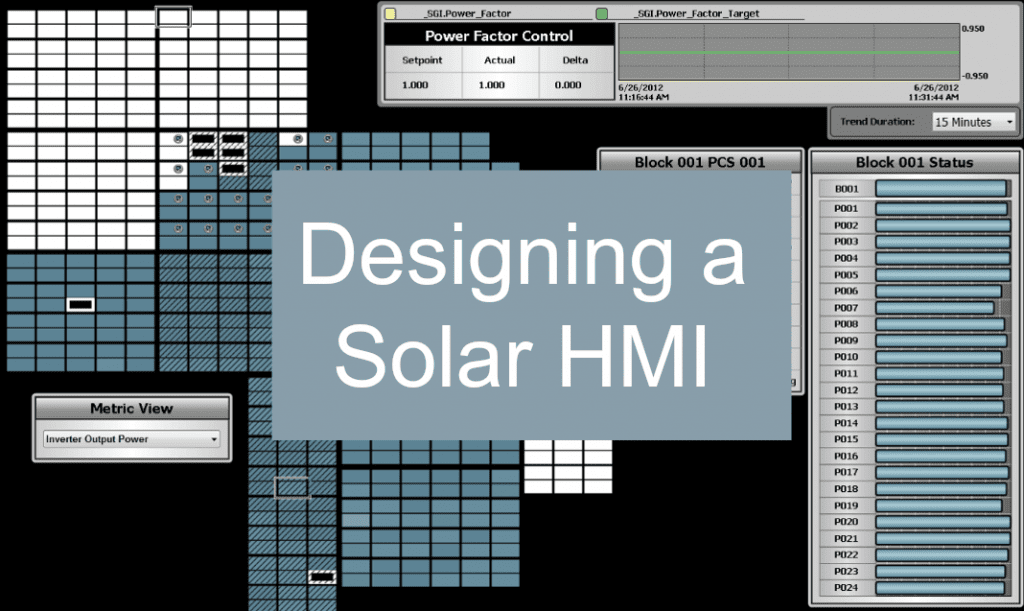
Designing a Solar HMI
Data is not particularly useful without context, and there are hundreds of ways to display a piece of information. Having a strategy to identify the most critical elements of operational performance will become more important as the amount of data to parse through grows.
Numeric displays give you specific values, but 500 numbers on a screen are difficult to make heads or tails of. Embrace meaningful representation where the EXACT value isn’t what’s important.
More value can be gleaned at a glance when things like bar graphs are used with normalized data to just show comparisons of how one part of a site is performing compared to areas around it. When a difference is identified, then is the time to go digging for information. Details need to be there too, but details should support the overview, and the two categories should be treated as distinct.